I led discovery research and service design for a Gates Foundation initiative exploring how a digital holistic support system could improve advising, financial planning, and academic navigation for students across minority-serving institutions.

Details are protected under NDA hence the blurred image. I created the information architecture and content for this journey map while working with designers for visual design.
Overview:
Project: Service Design for Gates Foundation
My Role: Senior Service Designer and Researcher
Scope: Discovery research for a digital holistic support system in service of students at minority-serving institutions
Methods: Remote Interviews, surveys, ethnographic research, synthesis workshops
Scale: Research informing an entire system including 16 platform features
Collaborators: Product Owner- CEO and other SMEs, Chief Strategy Officer, VP of Design Research and Strategy, VP of Partnership and Operations, Design Researcher, Designers, Gates Foundation Program Officers
Timeline: 06/01/24-04/01/25
Pe-Project Summary:
Optimistic Design was contracted to conduct design research via the Gates Foundation for this project which was stalled three times prior to my contract with this team. In order to launch this project, I would need to meticulously plan research to respond to client parameters while clearly articulating logic for pushback and nuance while working with a sensitive research populace.
Project Summary:
I planned and conducted discovery research to inform the build of a digital support system.
A digital support system can be thought of as a guide supporting oncoming college student as they navigate:
1. Pre-enrollment processes
2. Aligning their career goals with their major
3. Orientation
4. Registration
5. Taking Courses
6. Administrative Tasks
7. Planning their college course pathway by term
8. Graduation and post-college success
2. Aligning their career goals with their major
3. Orientation
4. Registration
5. Taking Courses
6. Administrative Tasks
7. Planning their college course pathway by term
8. Graduation and post-college success
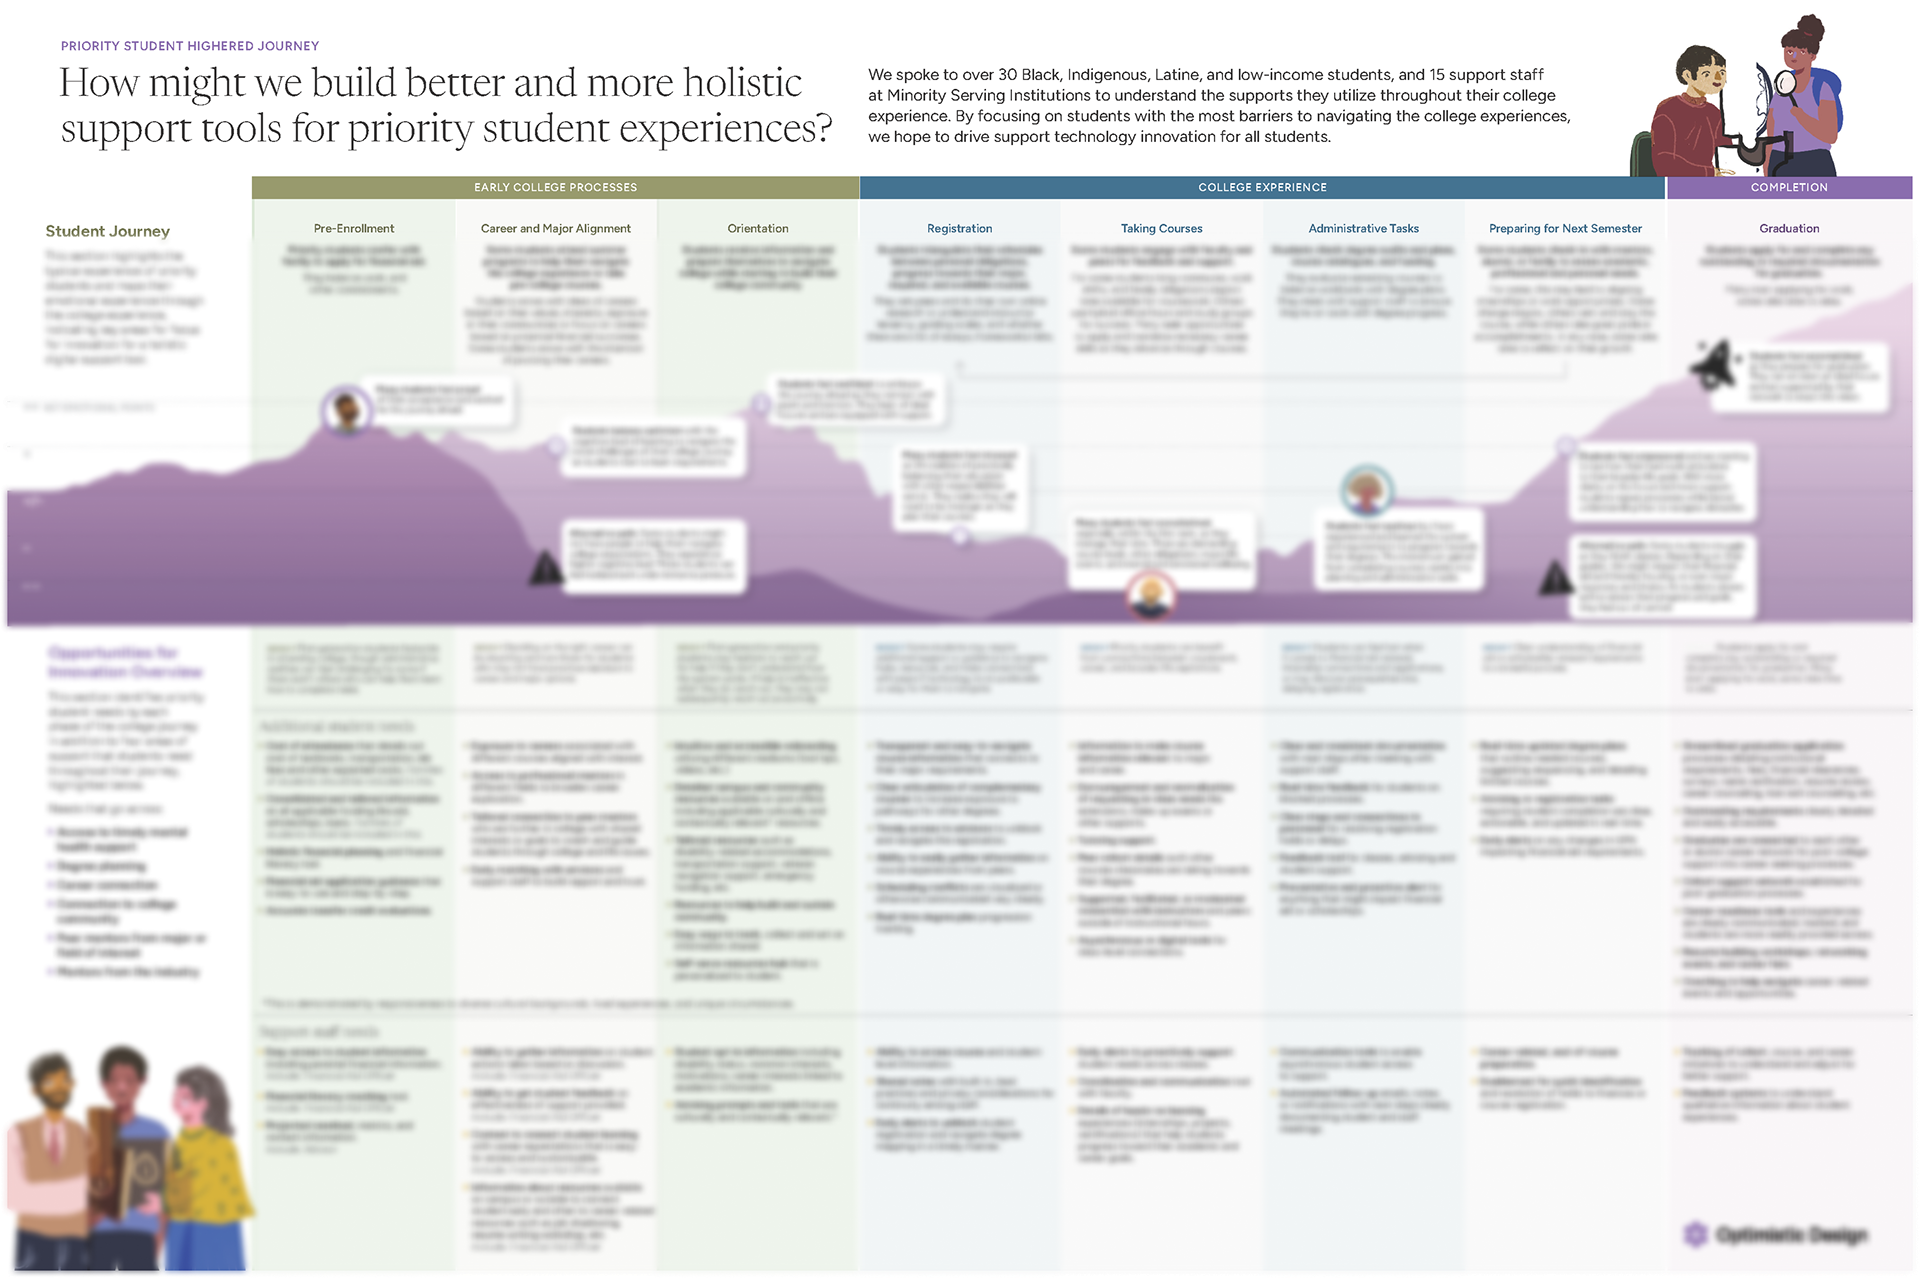
The project scope included deliverables mapping to define16 complex features incorporating in-person and digital touchpoints that should improve the retention, grades, and graduation of students from Black, Indigenous, Latine, and low-income backgrounds (referred to as our focus population hereafter) to successfully navigate and complete their college journeys.
The Problem
Students from historically marginalized populations are not applying or finishing college at the same rate as other students. Why?
Why does it matter?
It's no secret that philanthropic foundations fund future-facing research and product development areas in support of marginalized communities that also serve broader investments. By better understanding opt-out behaviors for college students, we can bridge more universal designs with opportunities presented by the factors that push students out of college in service of these students and broader investment strategies.
Research illuminates historical and future-facing possibility
By using ethnographic methods and speaking with students from historically marginalized backgrounds, we could more deeply understand systemic issues that bar entry and stimy success. Conversely, we can derive better understand strategies enabling their success.
My Contributions
For this project, I delivered:
• Insights and findings
• Diagrams and charts
• Principles
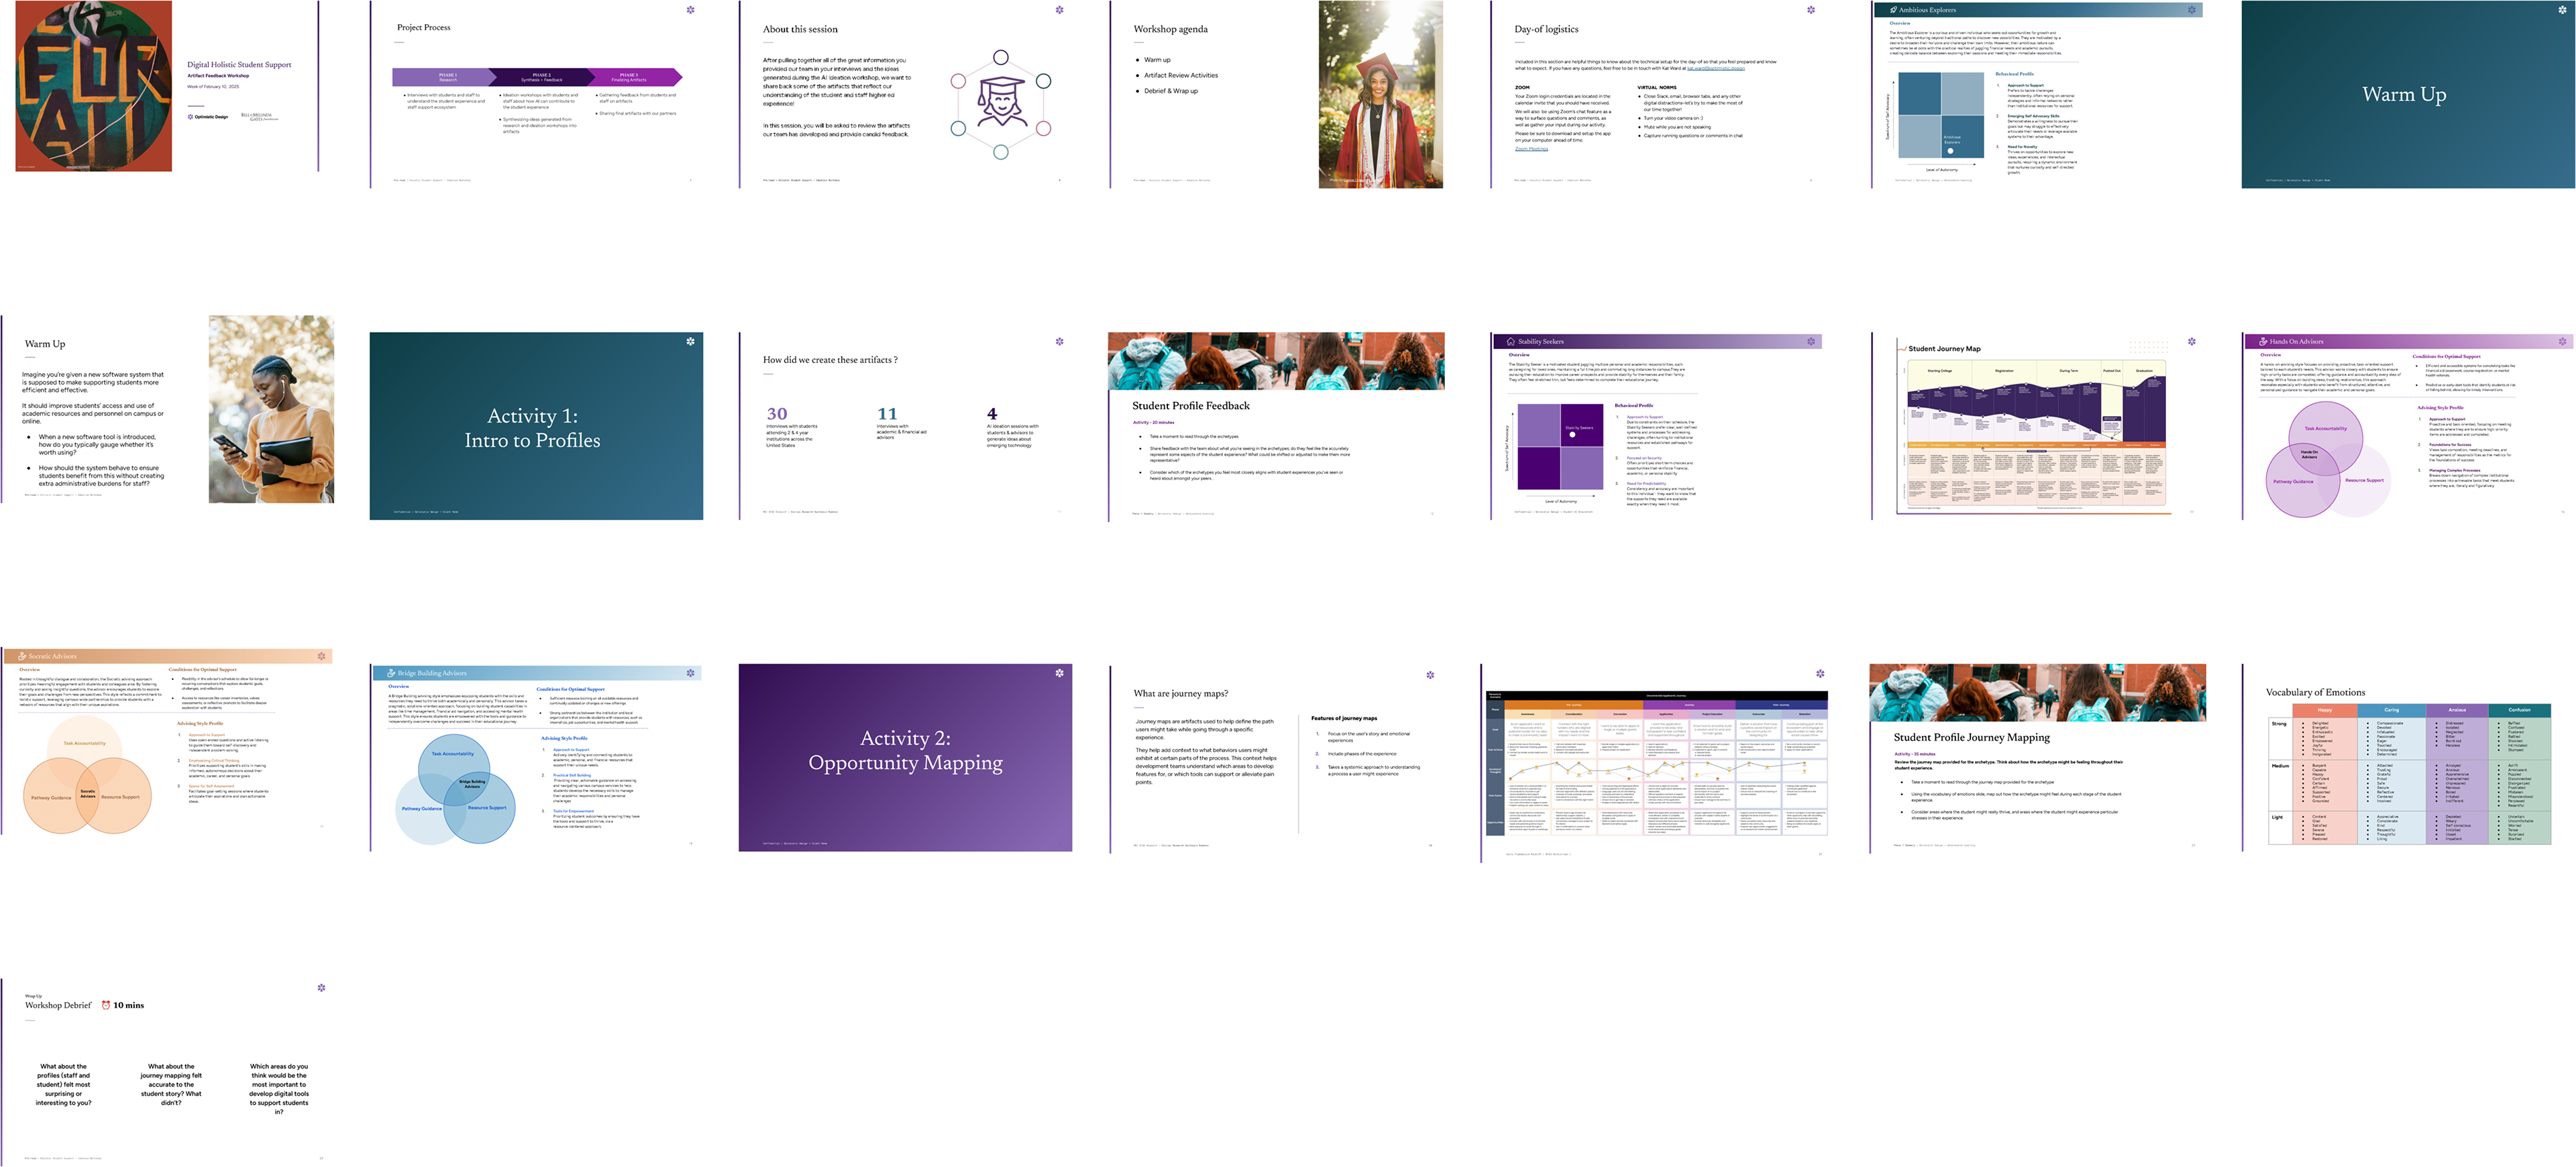
• A Student Journey Map
• Student and Staff Archetypes
• Diagrams and charts
• Principles
• A Student Journey Map
• Student and Staff Archetypes
To create these artifacts, I led the research and service design effort during discovery phase including:
• Designing the mixed-methods research plan
• Closely monitoring and reporting on research recruitment
v Conducting and managing interview data
• Synthesizing qualitative and quantitative data
• Facilitating stakeholder workshops to translate research insights into design opportunities
Research Process
Research Timeline
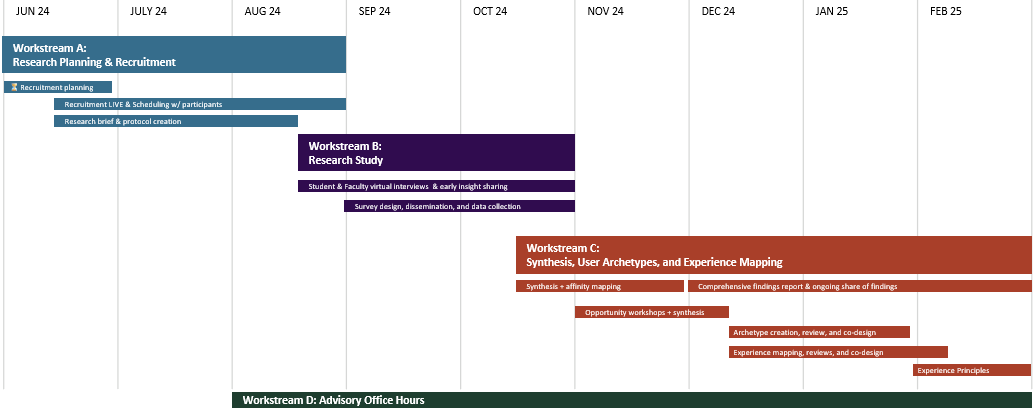
Research had 3 workstreams:
Workstream A:
• Planning and recruitment • Live recruiting and scheduling • Literature Review • Research brief and protocol creation including 3 guides: 2 for staff and 1 for students
Workstream B:
• Remote Ethnographic Interviews with students and staff • Survey design, dissemination, and data collection • AI Co-design Workshops with students and staff
Workstream C
Synthesis, User Archetypes and Experience Mapping
Literature Review
Findings
As I quickly onboarded to this project, I reviewed academic literature and institutional statistics to understand barriers and outstanding questions for students from the focus population to navigate and successfully complete college.
1. Black and Latinx populations, and even more so men, are increasingly opting out of college.
2. Many students from the focus population don't seek support.
3. Students from the focus population may have specific strategies to navigate their needs in college, and these should be surfaced.
4. Digital tools have a wide range of affordances but it's not clear what factors make some tools more or less effective.
Hypothesis: Before creating a new system, we need to better understand focus population baseline experiences to bridge historically unmet needs with emerging technology to create more universal designs. This is why I chose the specific tools to develop ethnographic interviews and more quantitative surveys to give more holistic insight from personal narrative and behavior.
Ethnographic Interviews
Key Questions
When do students seek support?
• Why? • How? • What obstacles do they encounter?
Agnostic of support, what do students do in order to navigate college?
• What works? • What doesn't?
What digital and non-digital systems, tools and staff do students leverage for help?
• What are their characteristics? • What is their behavior? • What makes this more or less effective?
Population; Fieldwork Recruitment Challenges
Population Dashboard
Recruitment required very specific parameters for students and staff alike. Transparency was key to enable the product owner to buy-in. So, I developed a population dashboard. You can view the parameters on the population dashboard here →
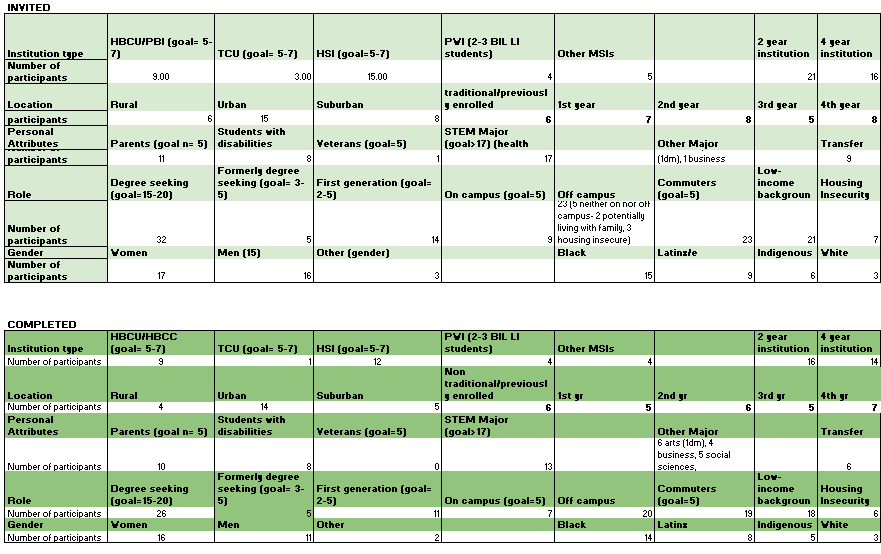
This was the most narrowly scoped recruitment I've ever done. This was updated and reported on daily.
Synthesis
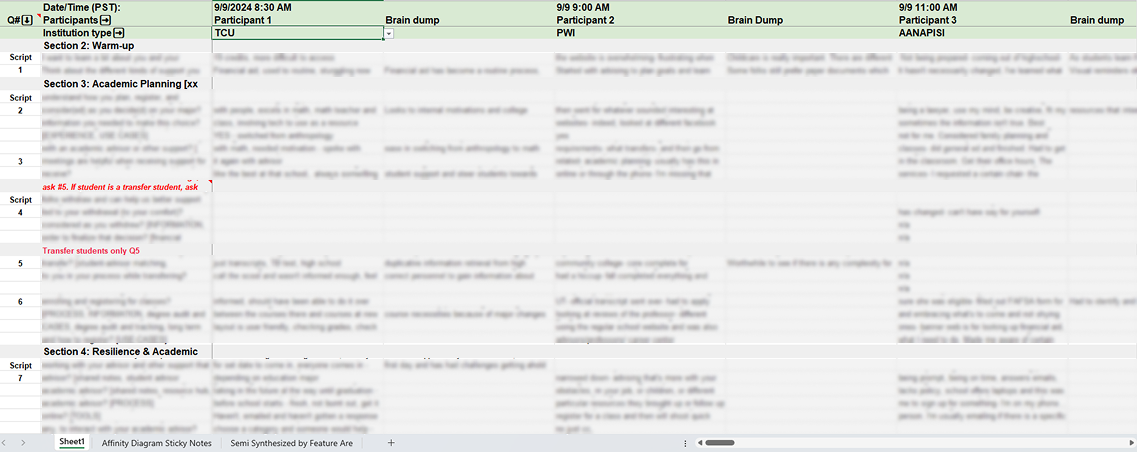
Note there are three tabs that helped to segregate data affinities by themes and then by features and institution type.
Information is blurred to protect sensitive data and NDA.
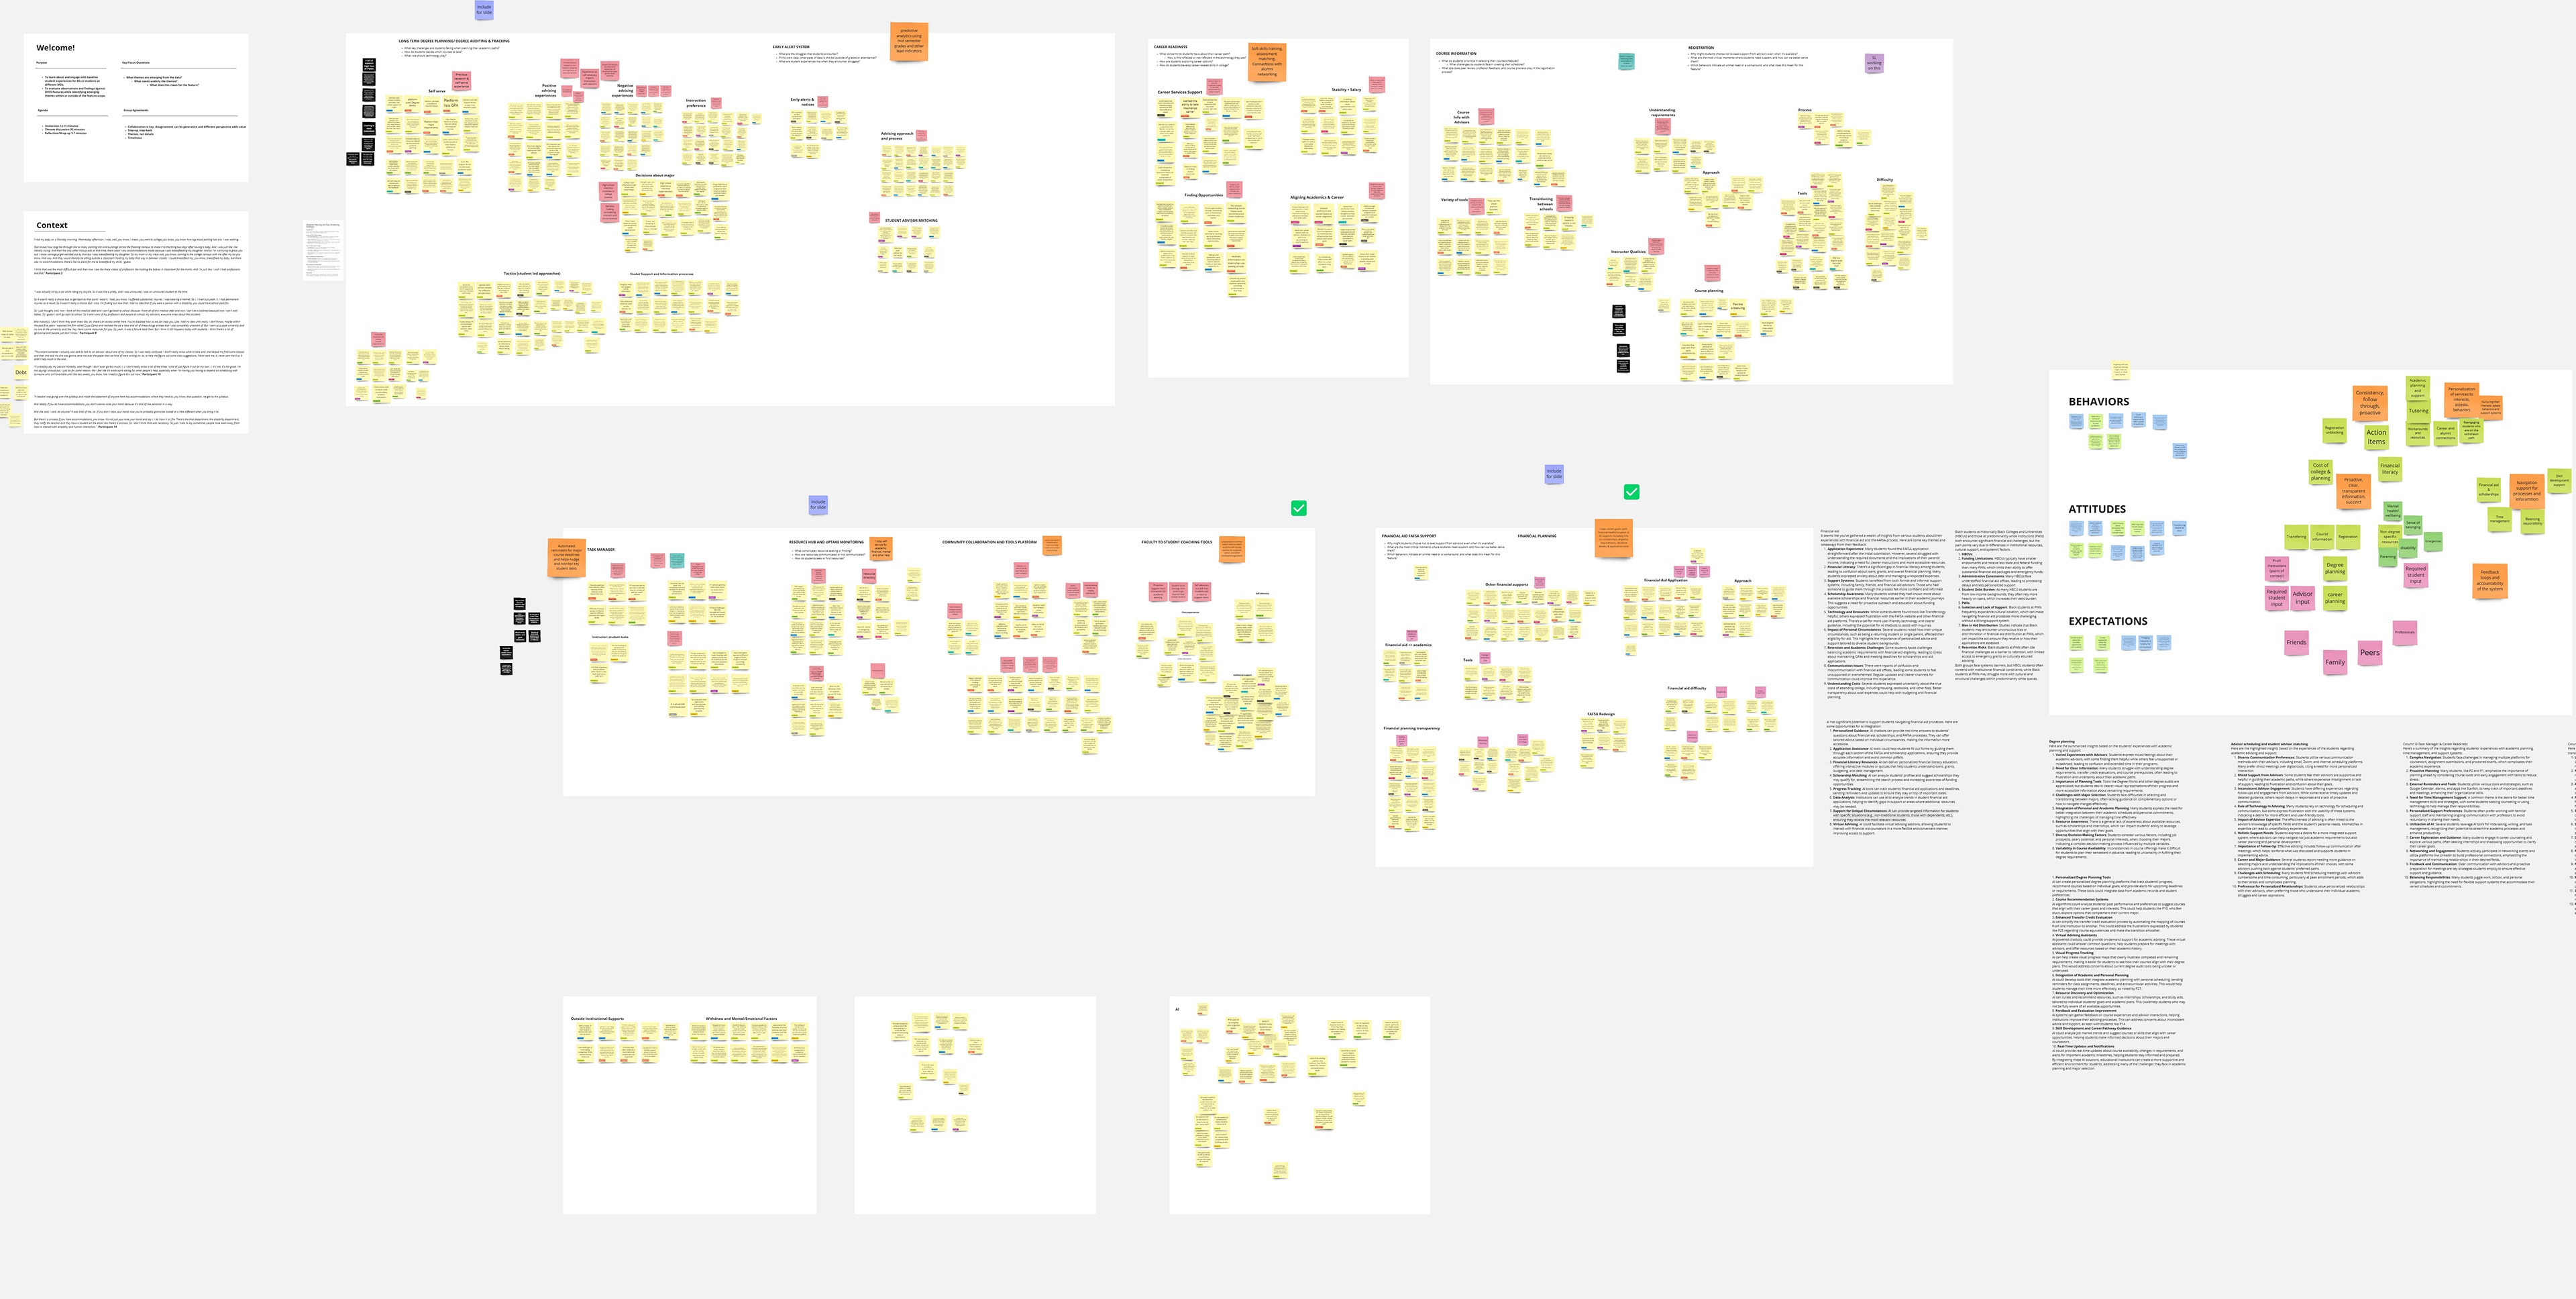
Features were matrixed against data, institution type, and student backgrounds to find emerging themes and patterns.
For survey data, we used Alchemer. Quantitative findings were synthesized with qualitative information. We reviewed
• Student behavior using specific software
• Ratings for experiences using software to support specific needs
• Frequency of use of different software features
• Ratings for experiences using software to support specific needs
• Frequency of use of different software features
We collected data from 22 students within our focus population (roughly a 20% margin of error- used to inform prioritization of feature needs and analyze against qualitative information for deeper insight)
I proactively coded information in data logs and Dovetail for qualitative information to map to specific features, processes, institution type, and student assets. Qualitative data covered:
• 30 students
• 15 support staff
• 16 features
• 15 support staff
• 16 features
Insights and Findings
There were many different insights that were uncovered from the qualitative and quantitative analysis. A few example types of insights include:
Students need proactive, illustrative information to convey pathways and self-advocacy skills. Many students need support to embolden their voice and direction.
Students find or give up on institutional supports. They will then rely on the internet, family, friends, or people that have otherwise walked the same path or may suffer in silence.
Students need integrated support rather than isolated services. Finances, academic planning, advising needs, etc. cascade from one to another and are disjointed.
Product Feature Opportunities based on a repository of mentioned software and additional competitive analysis focused on feature affordances, I compiled specific highlights from software that students liked, while identifying feature opportunities for a new system, and shared it out with a deck.
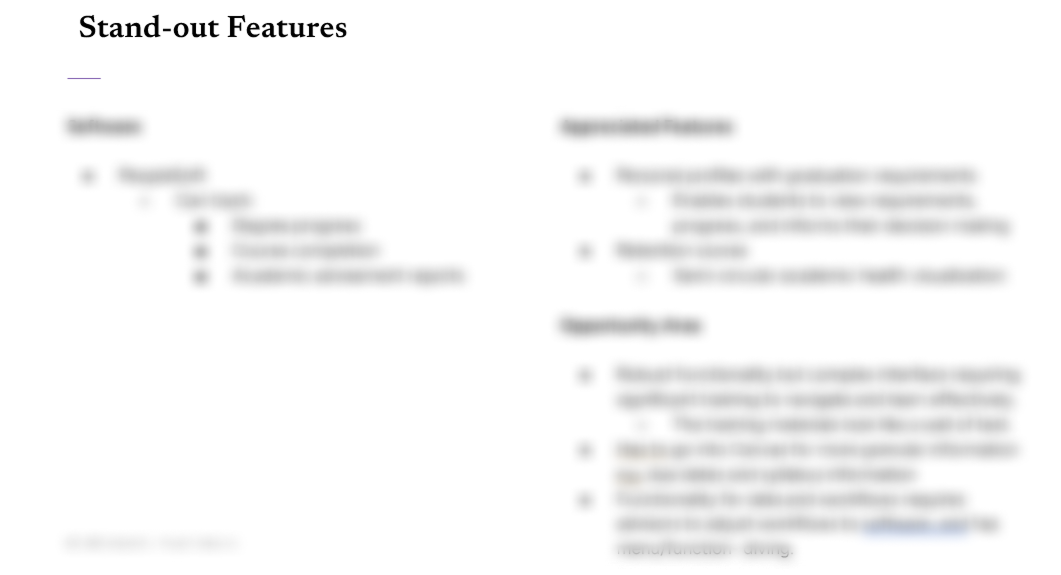
This is blurred to protect NDAI analyzed products for students' most appreciated features, and opportunity areas based off primary and secondary data.
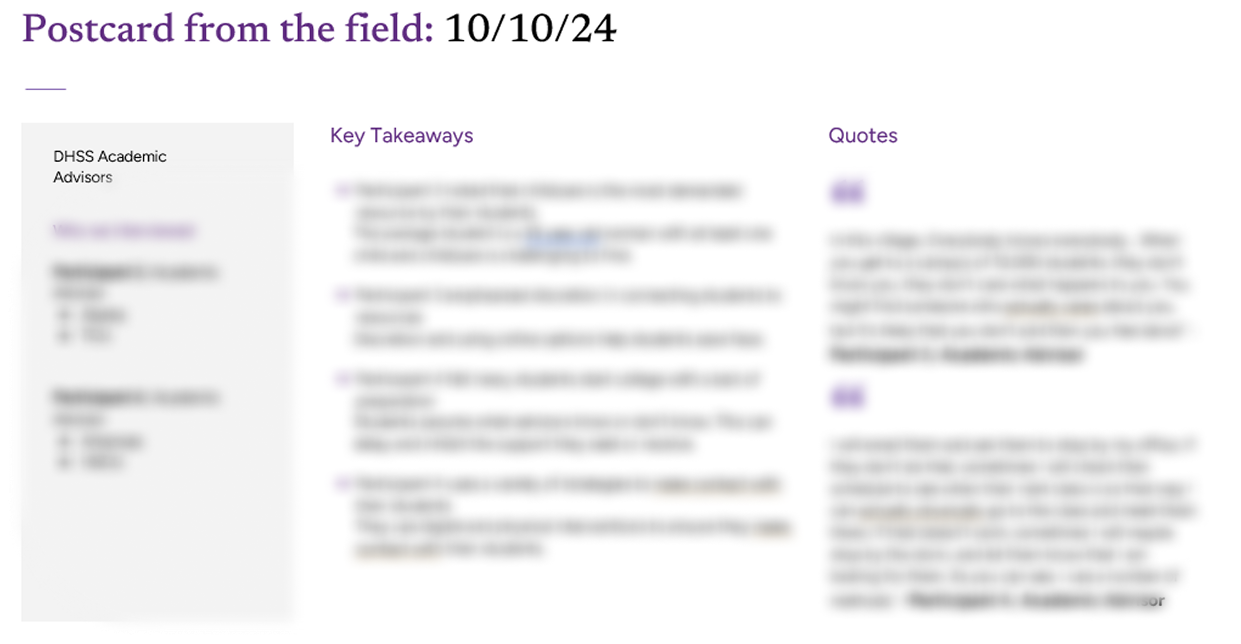
Postcards from the field
Postcards are "snapshots" of real-time takeaways for individual participants provided to stakeholders while research was ongoing.
Themes From Qualitative and Quantitative Research: Students
Themes for students covered 5 different domains of the student journey using qualitative and quantitative derived insights including:
1. Information
2. Behavior
3. Navigation
4. Personalization
5. Feedback
2. Behavior
3. Navigation
4. Personalization
5. Feedback
Student Relational Mapping
While reviewing the data, we uncovered student relationships that impact their college navigation and support processes and how this enables them to succeed. I mapped it.
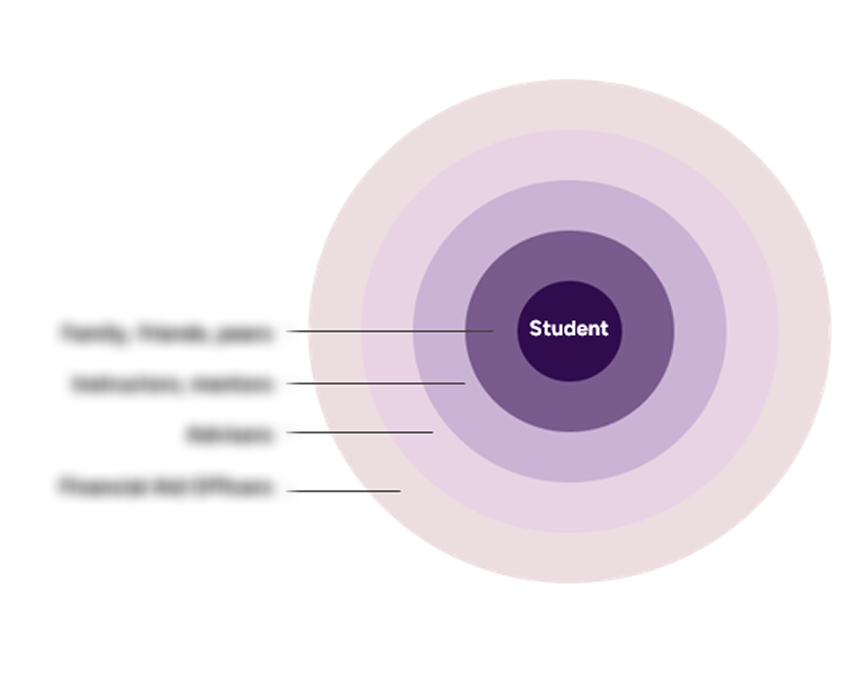
This is blurred to protect NDA
Themes From Qualitative Research: Staff
Emerging themes covered 4 domains including:
• Information
• Affordances for specific tools
• The process for specific alerts and nudges
• Formal and informal processes to connect with students
• Affordances for specific tools
• The process for specific alerts and nudges
• Formal and informal processes to connect with students
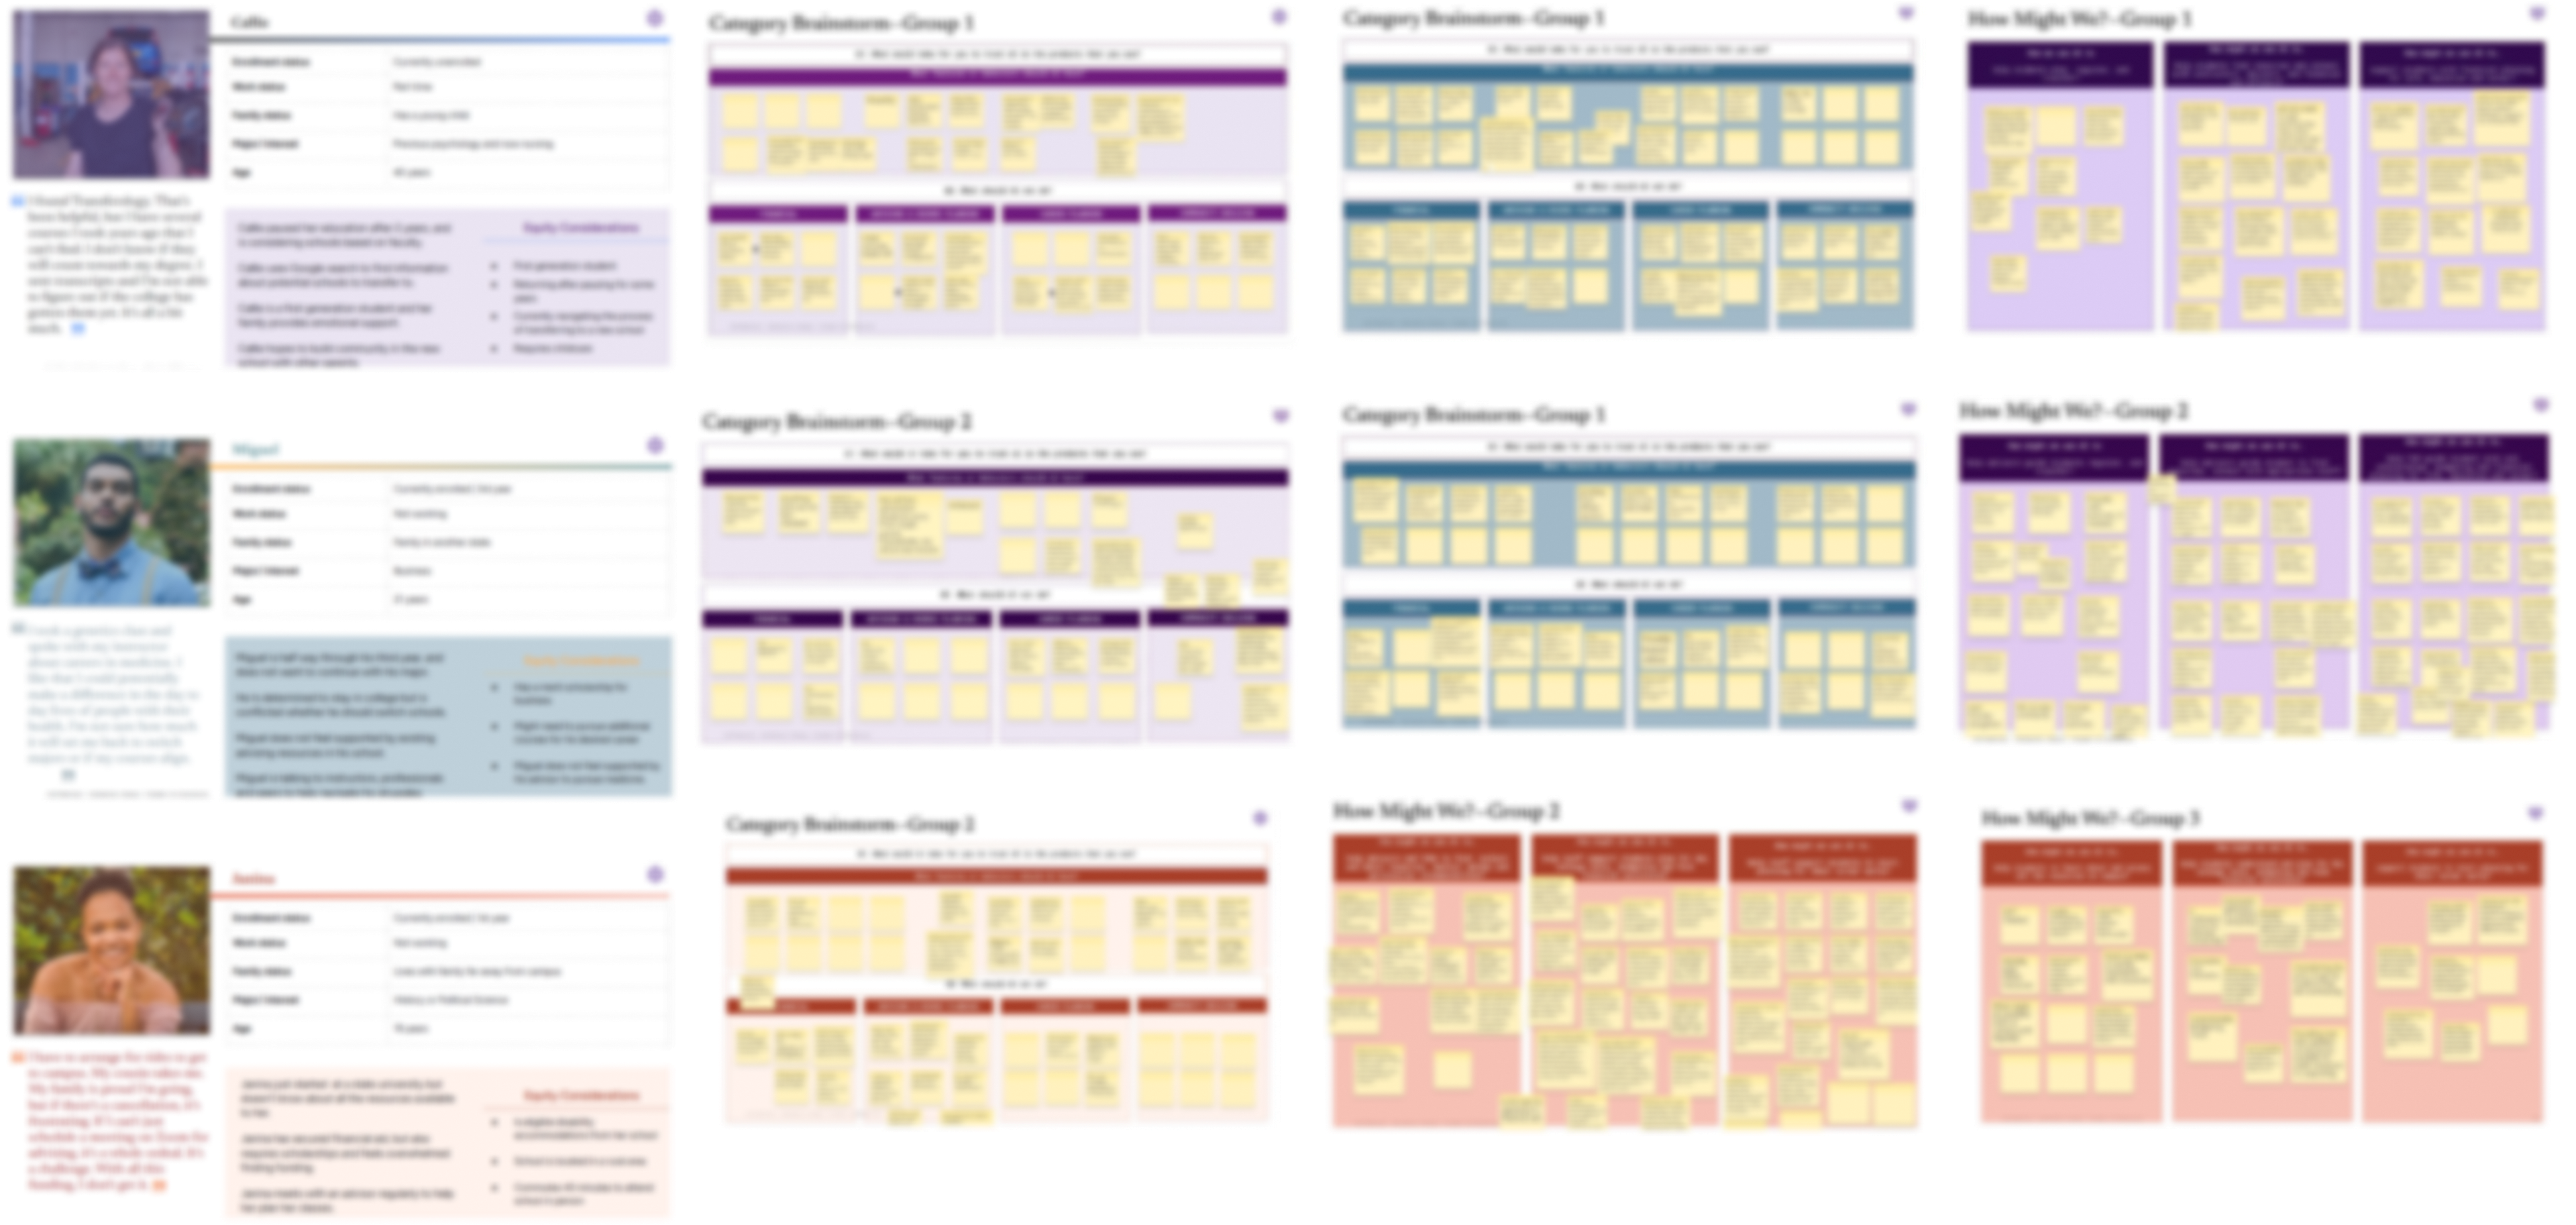
Workshops
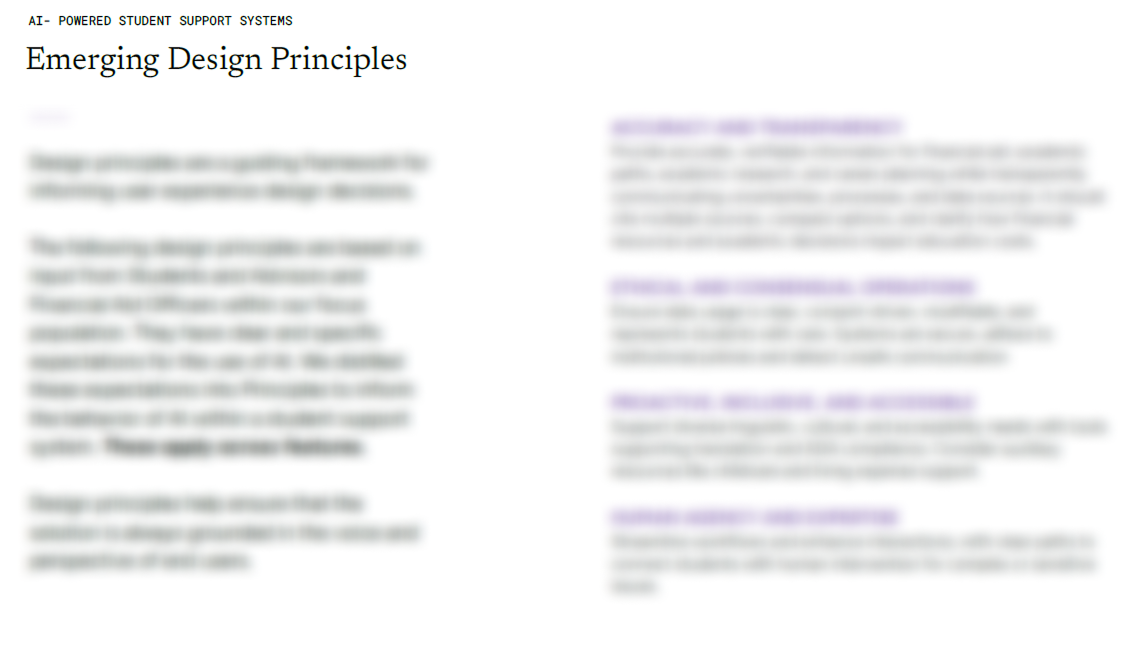
Workshopping findings to define Principles for AI within Support System
Themes for Incorporating AI within the Support System
We drafted personas to demonstrate use-cases derived from findings, and workshopped them with students and staff to determine principles for the use of AI.
This consisted of:
• Having students and staff read through Personas
• Prompts to think about how a system might respond to their needs
• Guided brainstorming to elicit their needs that might impact their use of AI
• Prompts to think about how a system might respond to their needs
• Guided brainstorming to elicit their needs that might impact their use of AI
Though I can't share the specifics here, our workshopping uncovered recommendations for the use of AI within:
• FAFSA and financial planning
• Advising and Registration processes
• Career Planning Processes
• Community Building and Resources
• Advising and Registration processes
• Career Planning Processes
• Community Building and Resources
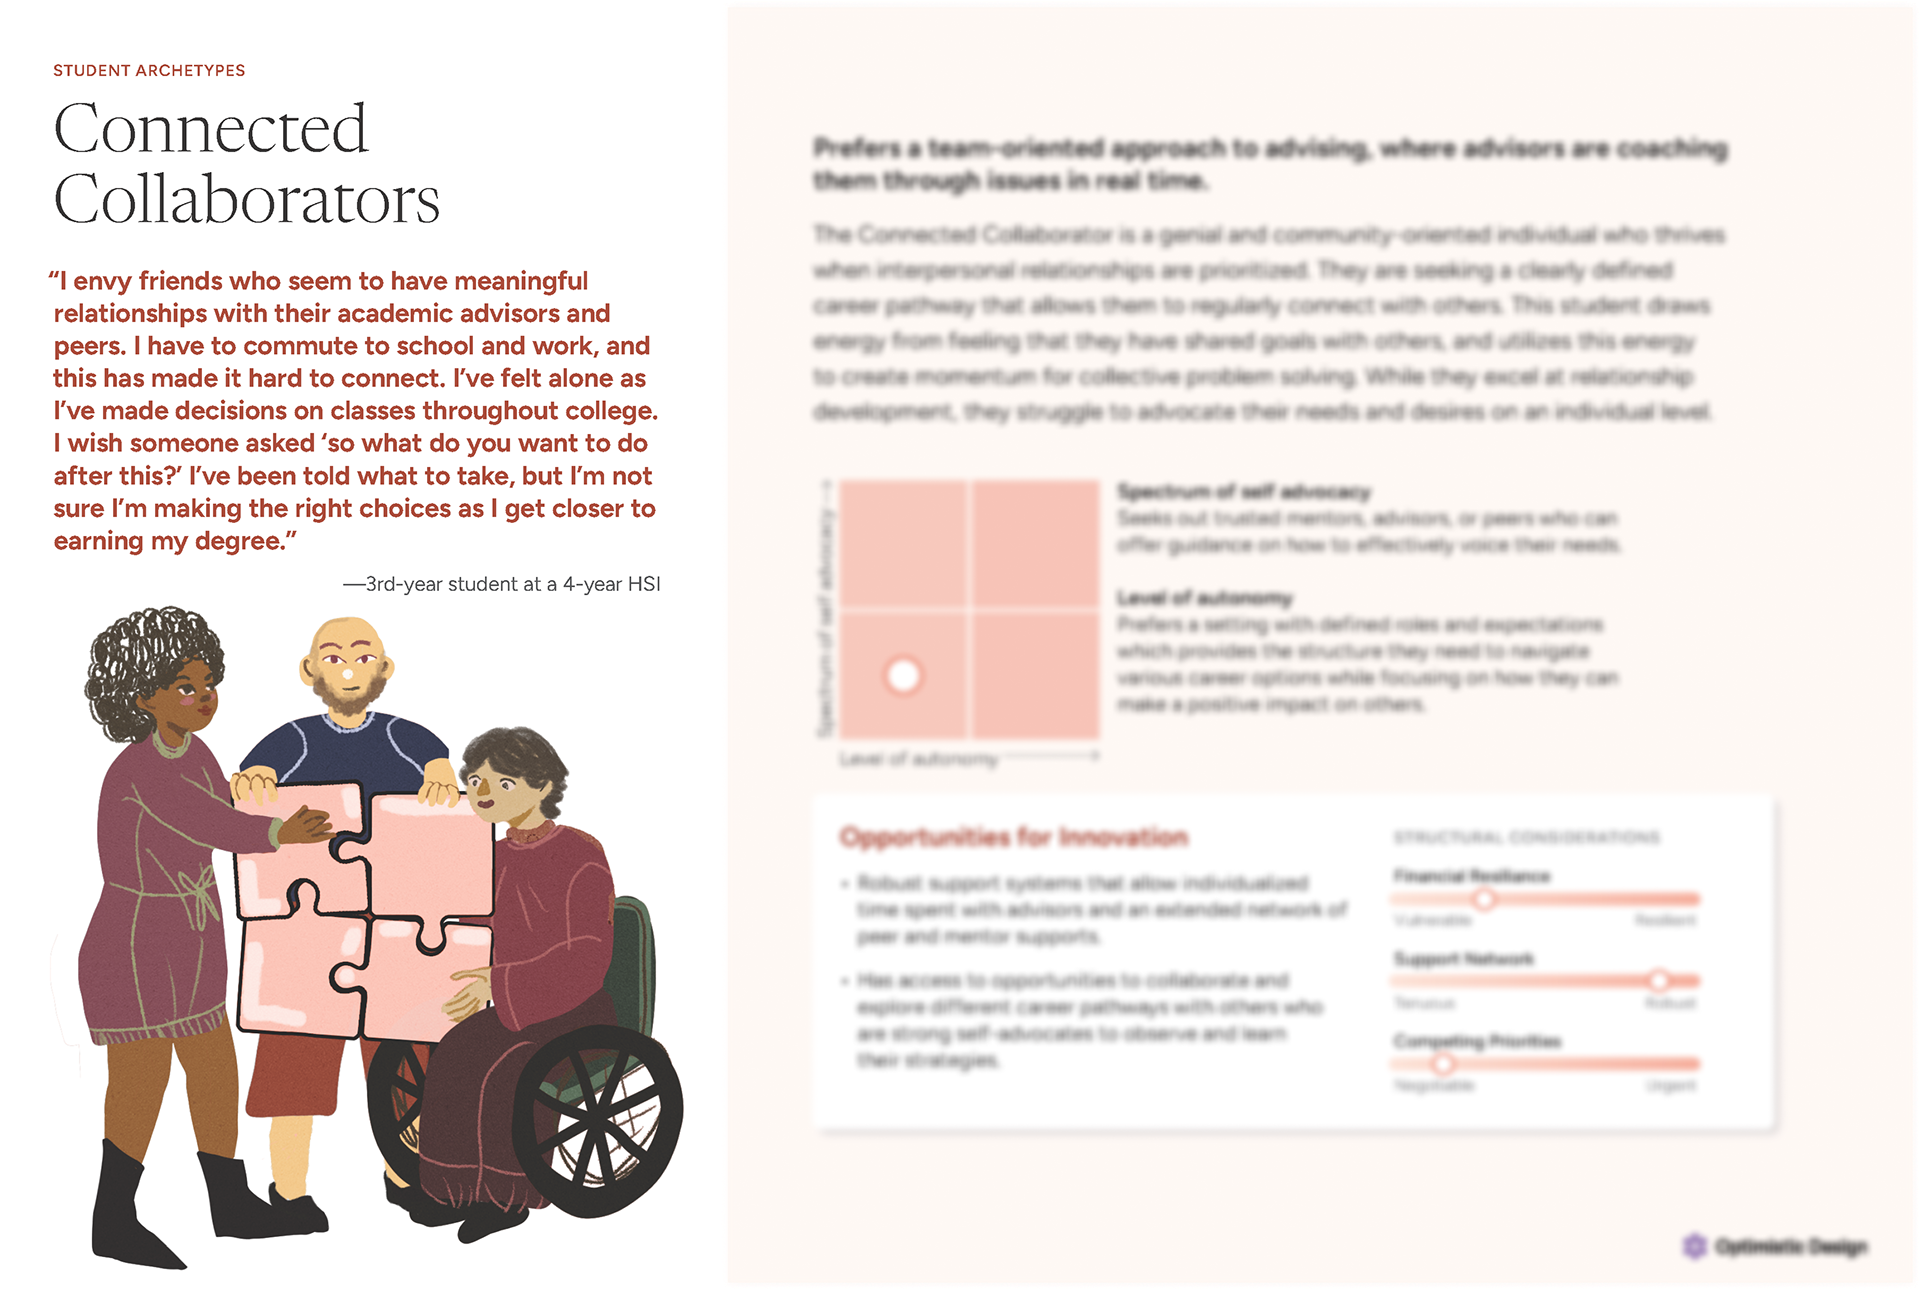
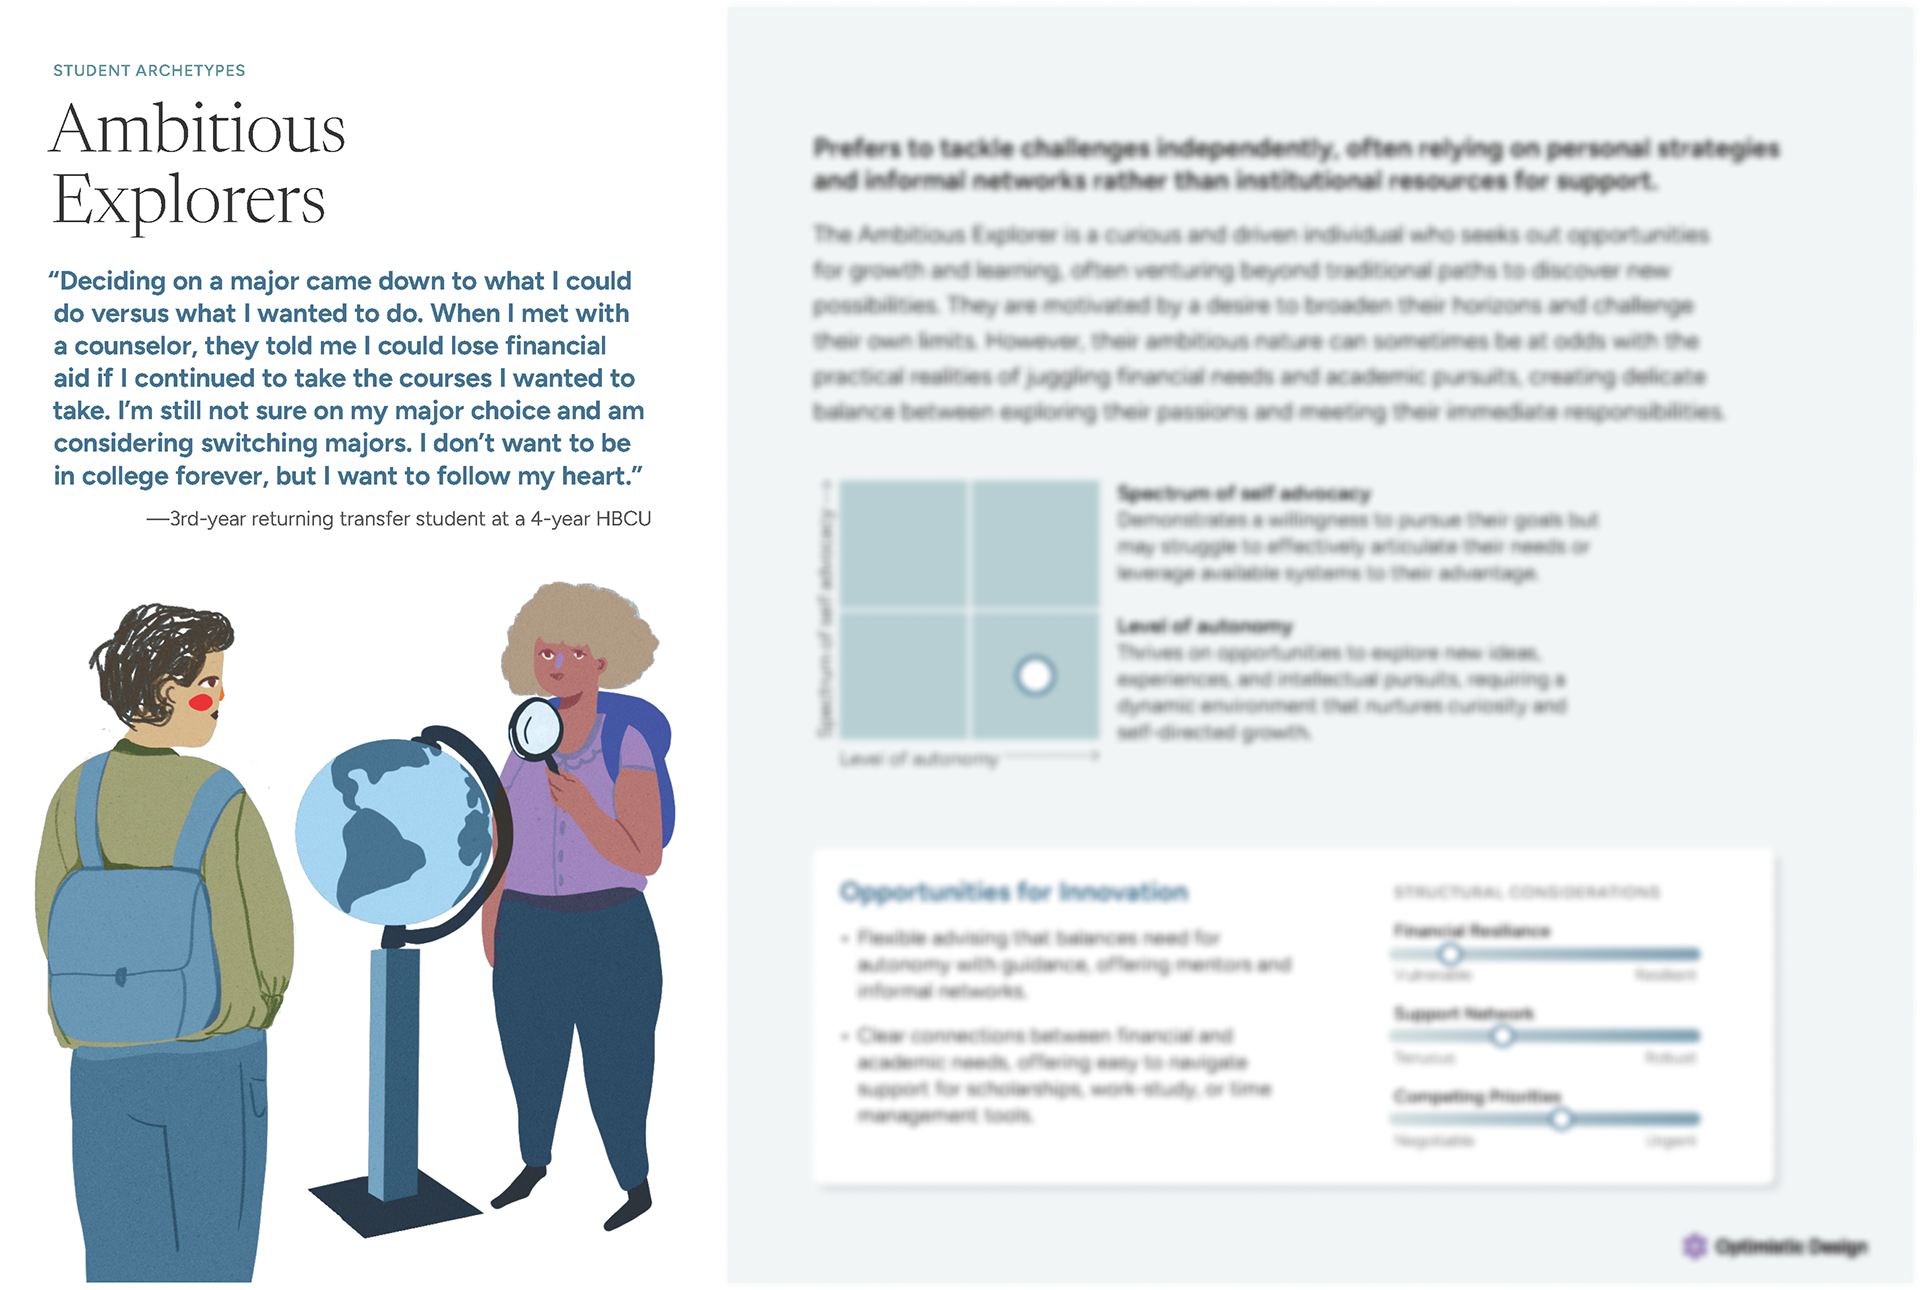
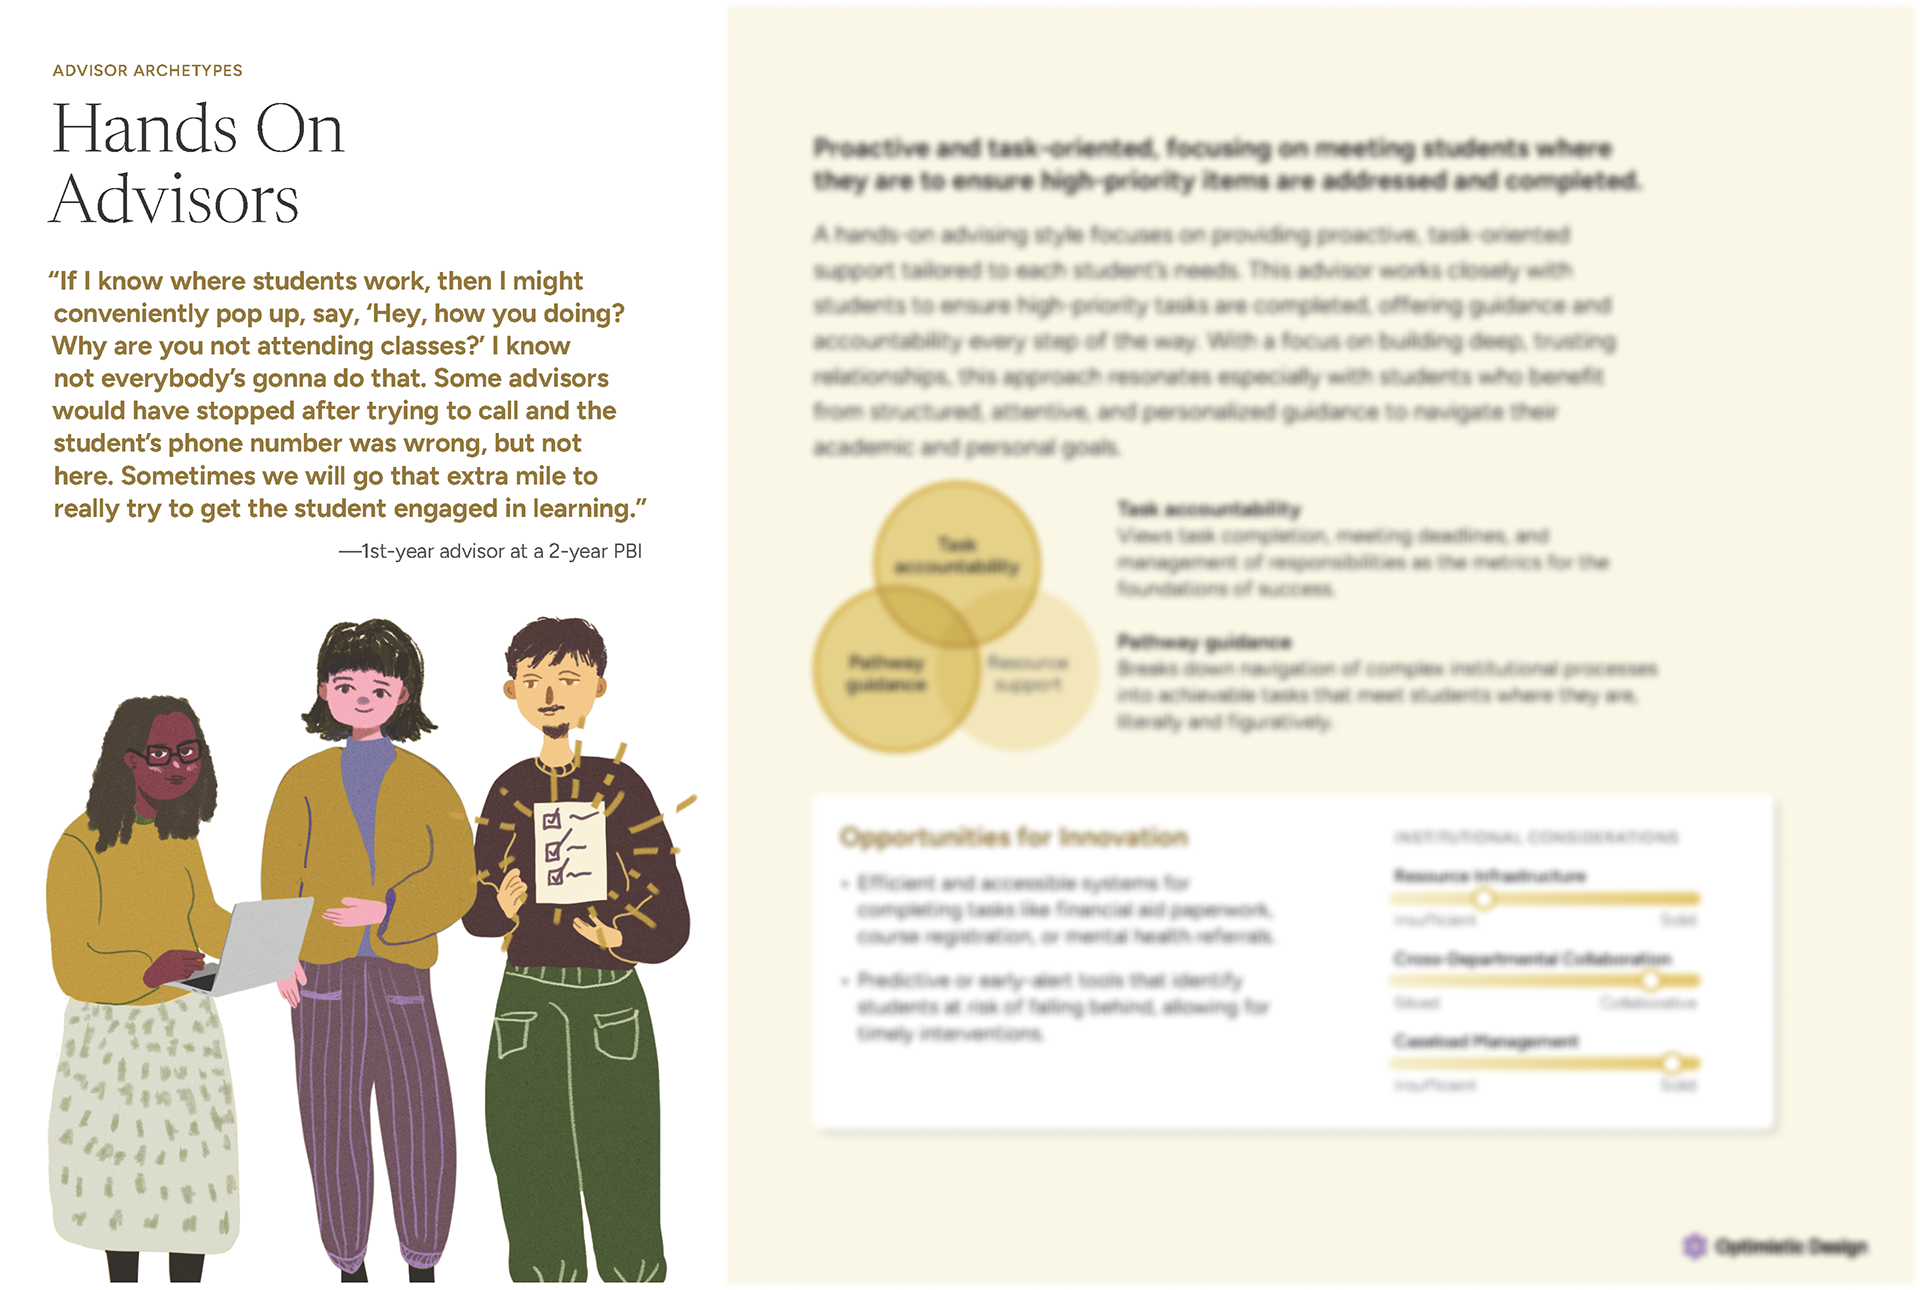
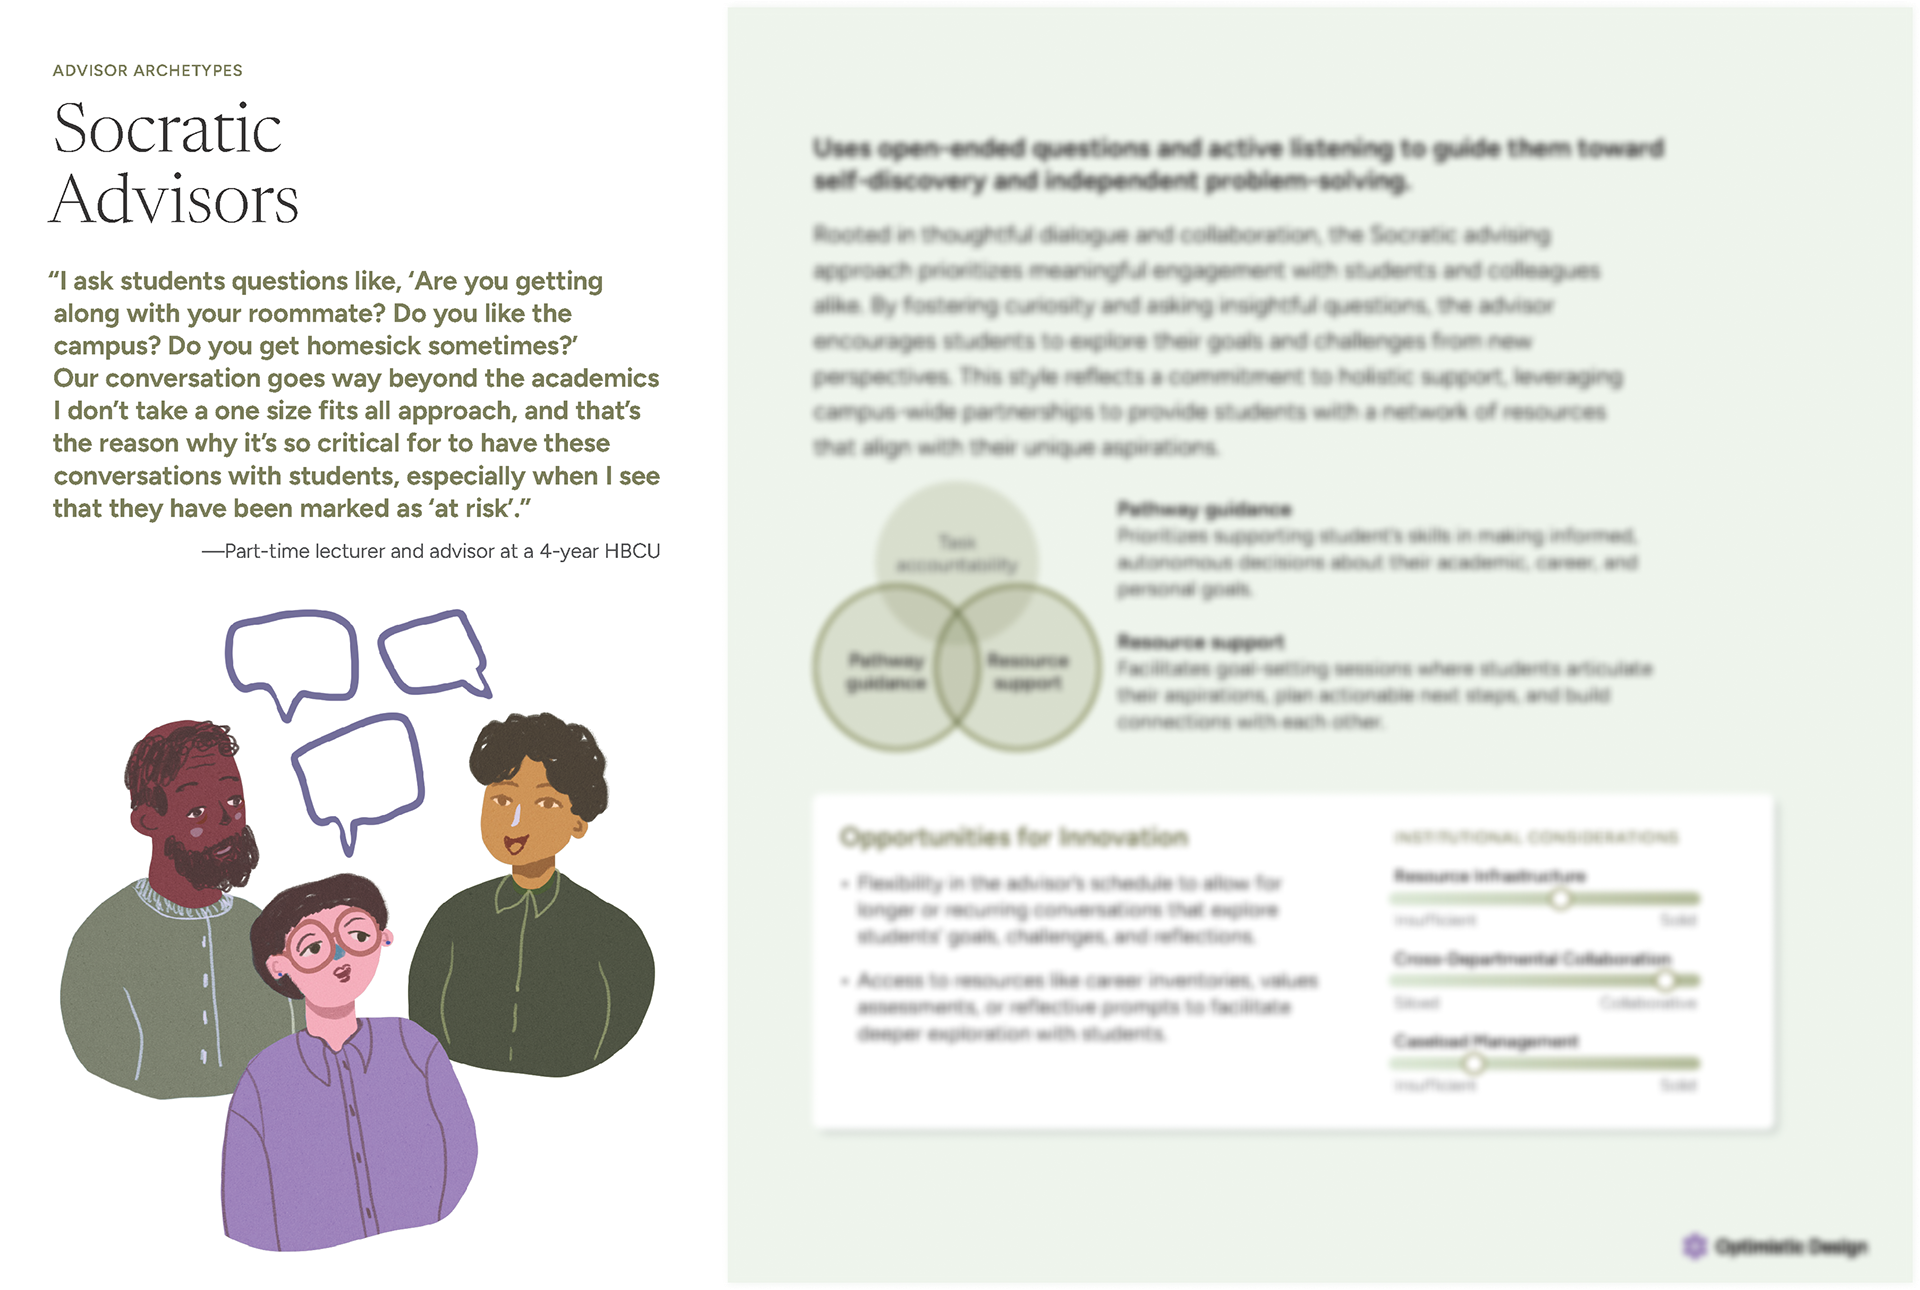
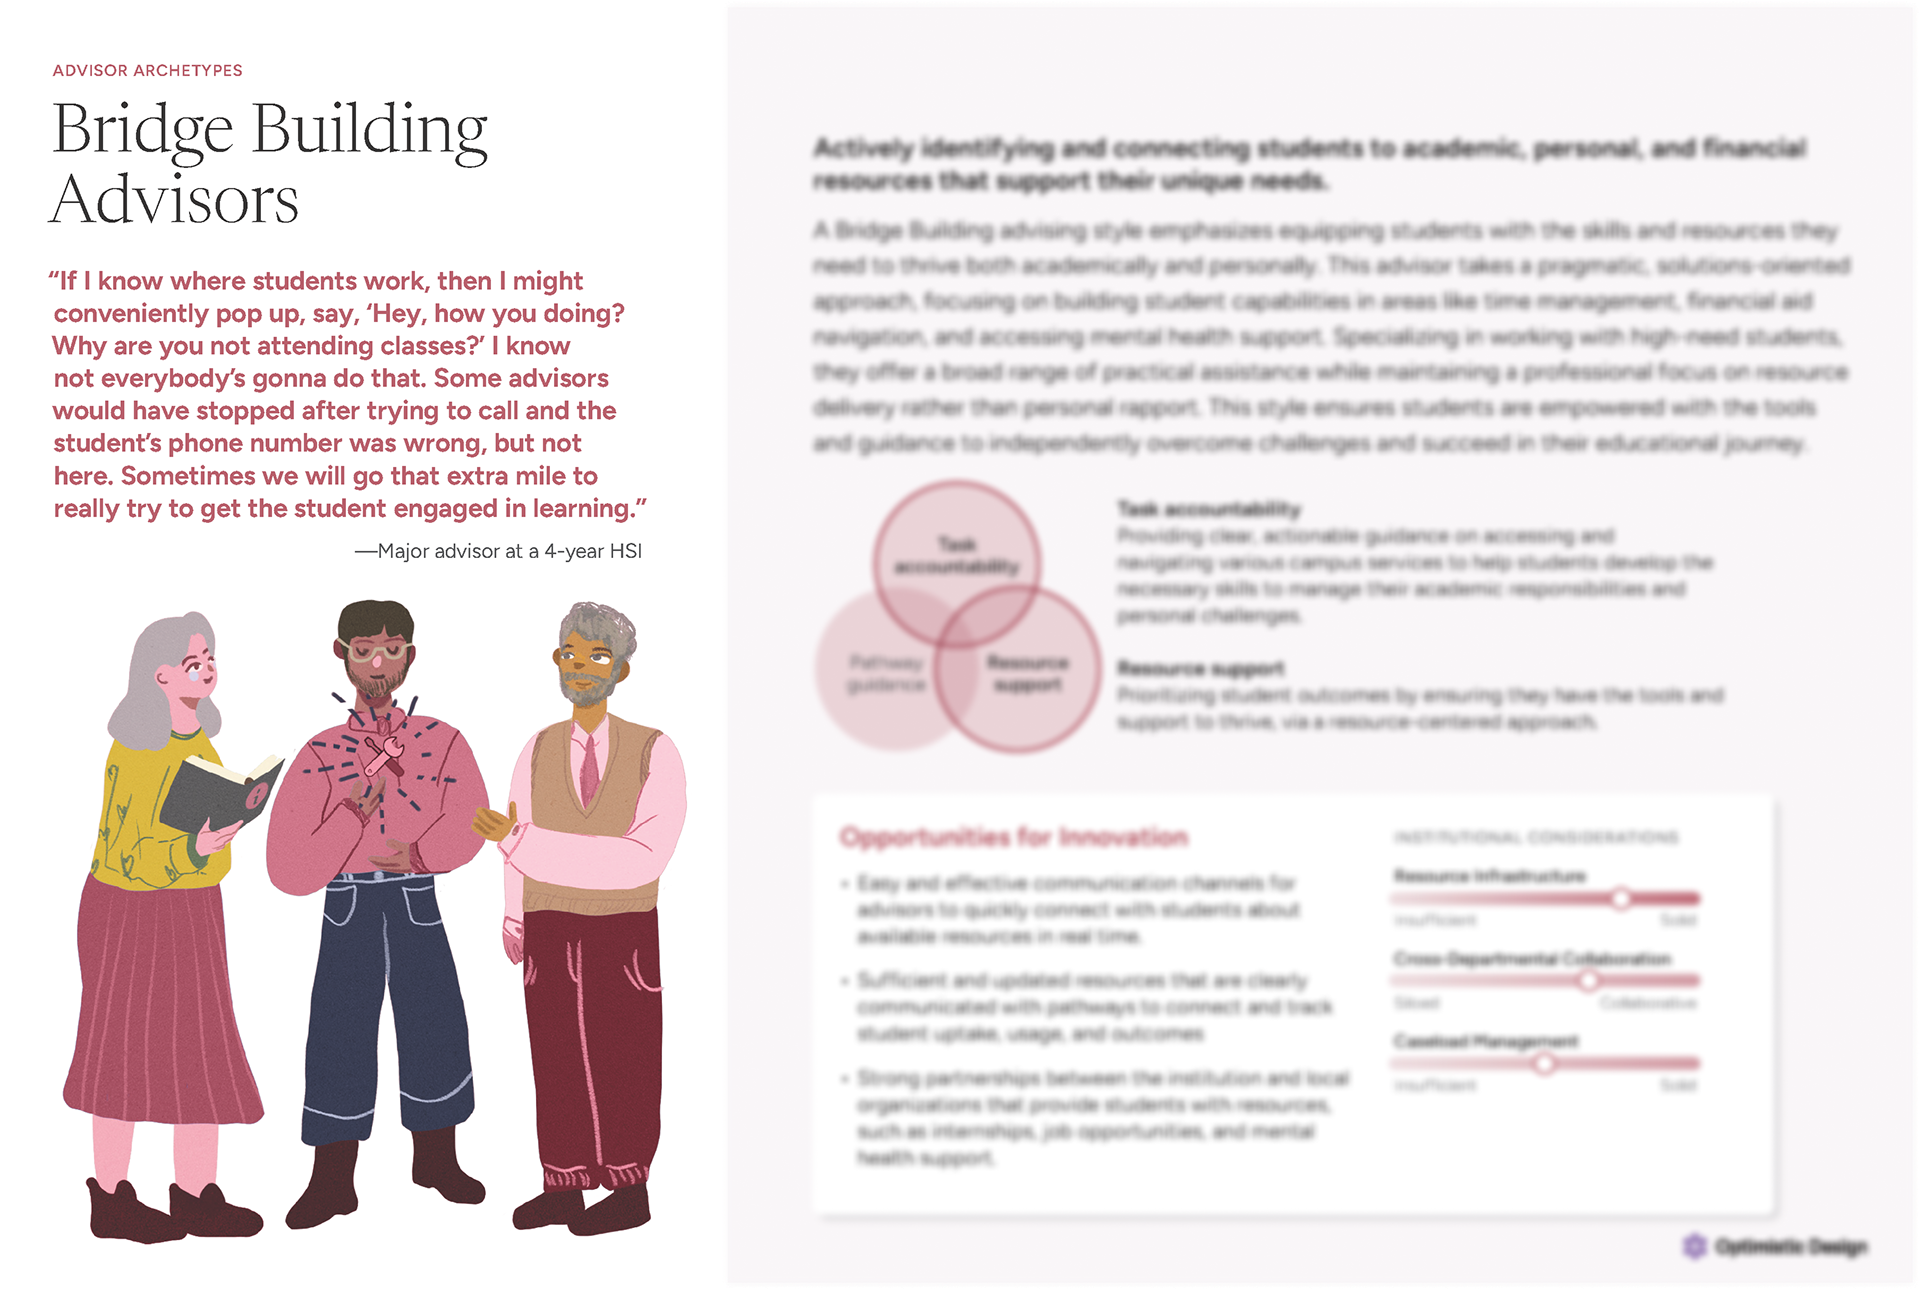
Archetypes
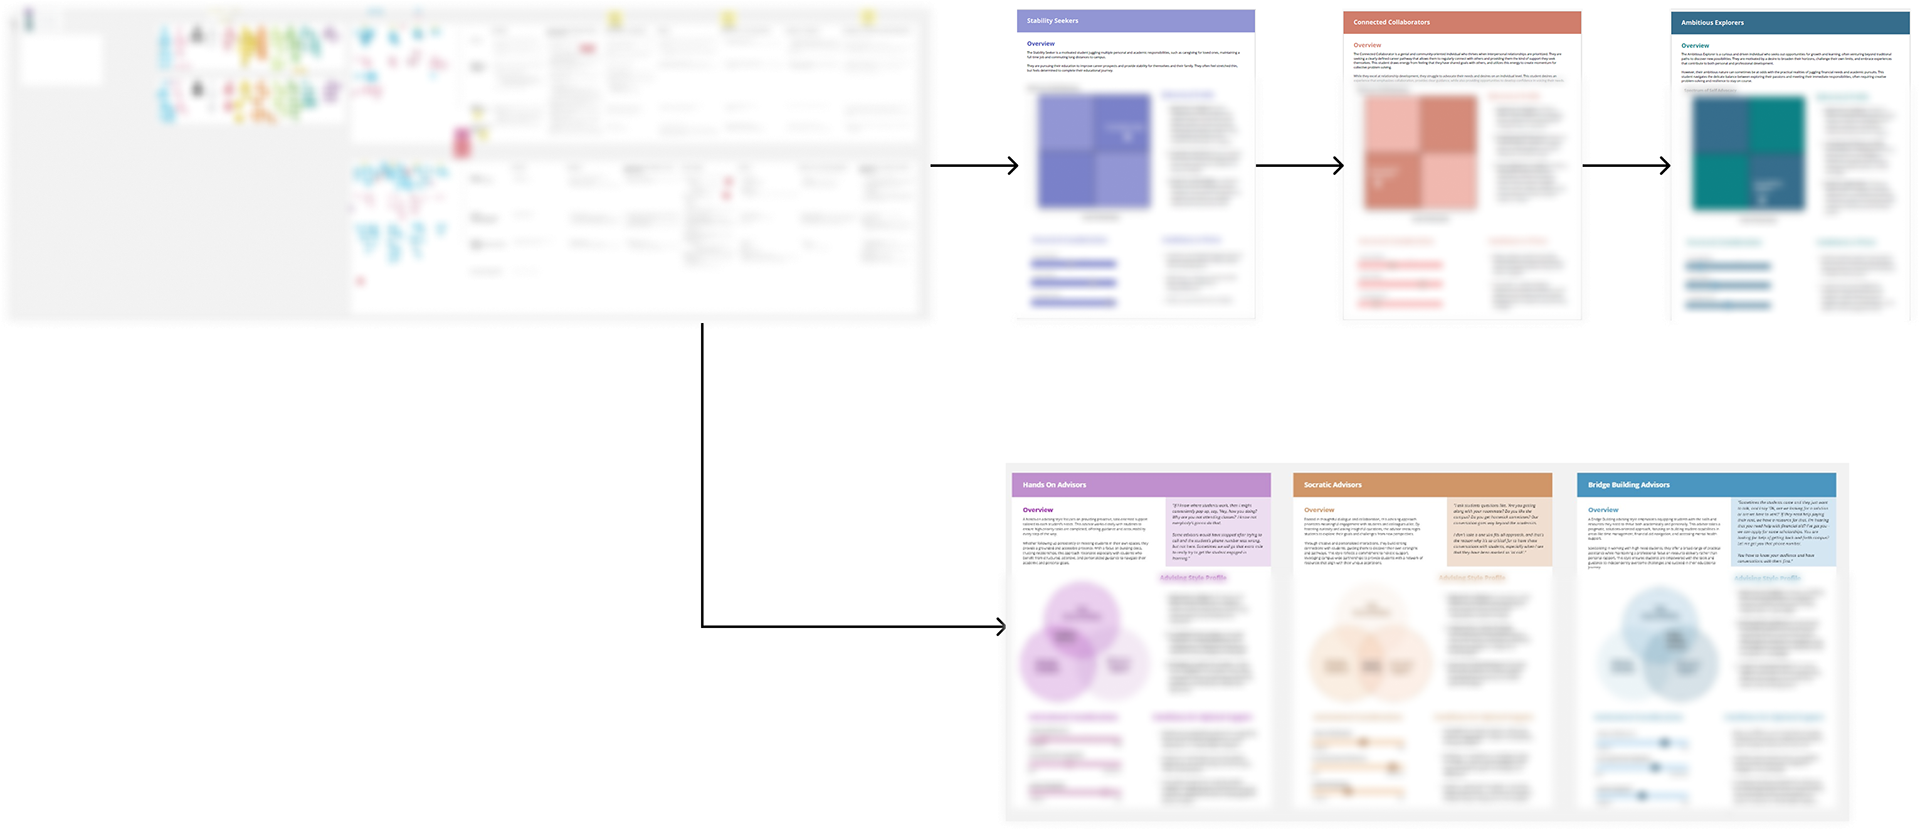
This outlines the iterative design process in synthesizing data to final archetypes.

Archetypes are blurred to protect NDA
Archetypes are blurred to protect NDA
Archetypes are blurred to protect NDA
Archetypes are blurred to protect NDA
Archetypes are blurred to protect NDA
Archetypes are blurred to protect NDA
Archetypes are distinct from personas. We created archetypes based off specific aggregated behaviors, motivations, and types of support that emerged from student data across institutions and institution types. I scaffolded the content while workshopping and delegating the initial draft of the remaining copy to another researcher, which we refined together. I edited the final copy.
Archetypes are intended to be used in conjunction with the journey map aid with ideation processes across pivotal touchpoints within student journeys.
Journey Mapping
The support system would need 16 specific features across 8 major phases of the student journey including:
1. Pre-enrollment processes
2. Aligning their career goals with their major
3. Orientation
4. Registration
5. Taking Courses
6. Administrative Tasks
7. Planning their college course pathway by term
8. Graduation and post-college success
2. Aligning their career goals with their major
3. Orientation
4. Registration
5. Taking Courses
6. Administrative Tasks
7. Planning their college course pathway by term
8. Graduation and post-college success
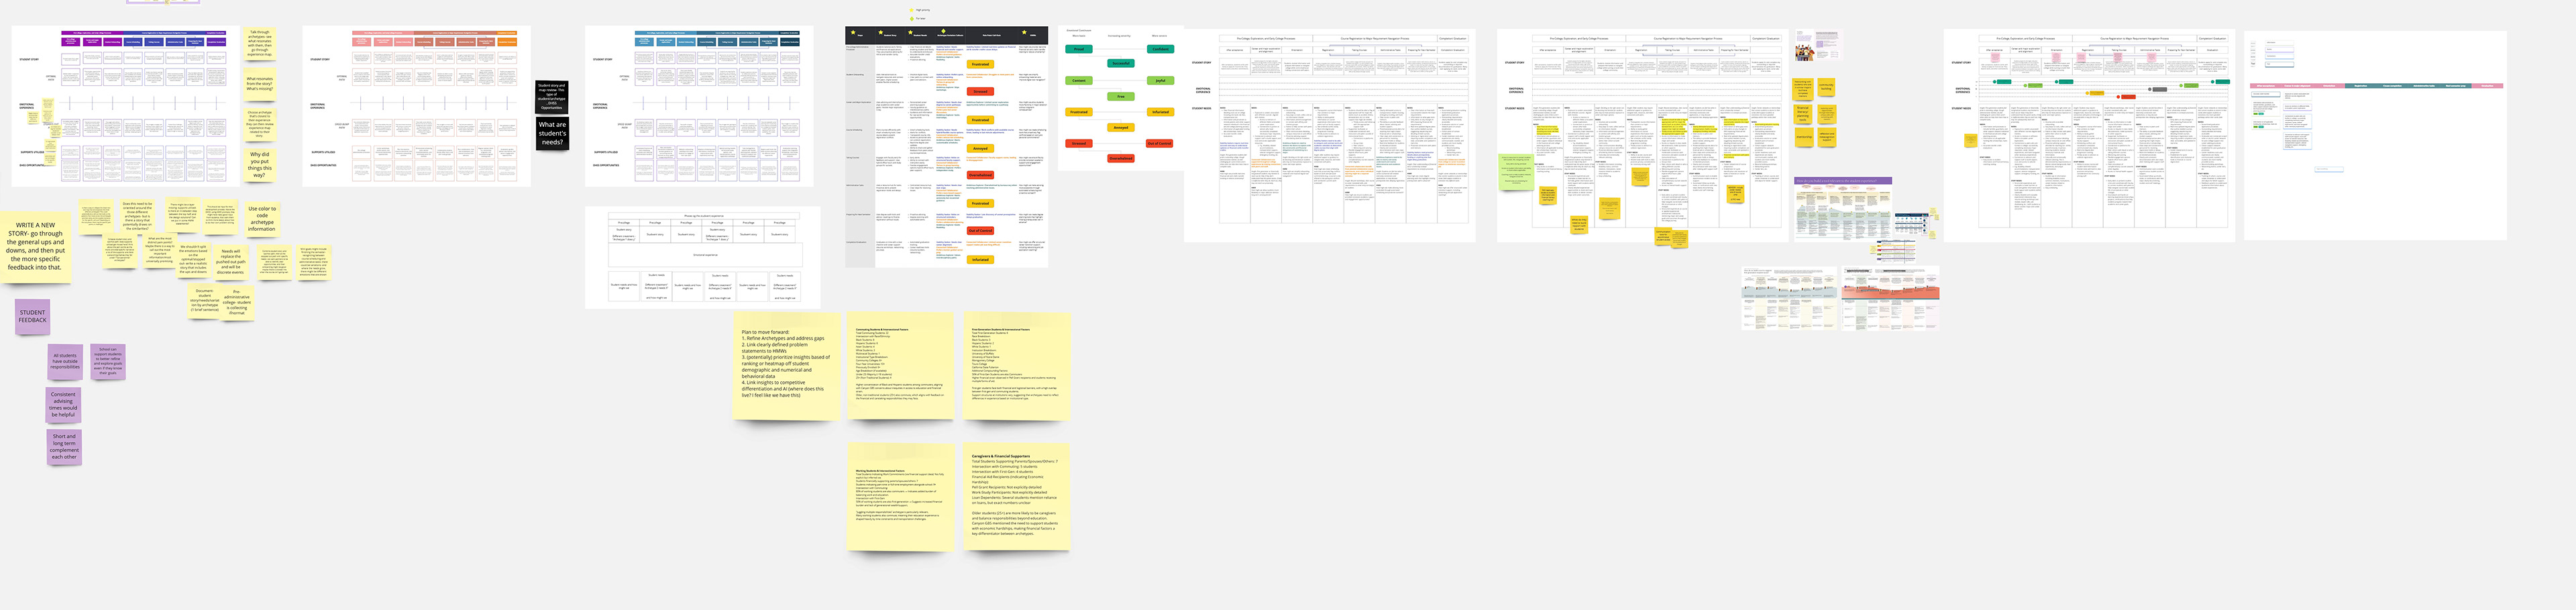
This process was extensive. I went through 12 different drafts before finalizing copy for the completed version.
Evaluating the Archetypes and Journey Maps
We workshopped the archetypes and journey maps to evaluate whether or not students felt their experiences were well-represented. It was important that our findings surfaced novel information that could directly feed into a market differentiating support system- one that truly supports students from marginalized backgrounds.
We set this up on a Zoom whiteboard, received notes from participants and synthesized while we built out the final version.
Images were blurred to maintain confidentiality of data.
Completing the Journey Map and Sharing Findings
I finalized content with the CDO and VP of design across journey maps and archetypes, compiled a repository of the research and prepared a shareout.
Outcomes and Impact
I informed the strategic direction for digital student support platforms of tomorrow. Though this was built for a specific partner, this can also be used by other organizations working in this space through the Gates Foundation to bolster national scale efforts to support the focus populace.
I guided opportunity ideation across student college journeys and specifically 16 complex product features specified to a product and generalized to national scale.
Reflections
This project was a massive undertaking. I learned it's paramount to discuss constraints with logistics of highly specified participant groups. In a brief I put together to determine a recruitment agency, we were quoted over $50k for the specific parameters. This was not feasible. Moreover, working with MSIs, and specifically Tribal Colleges and Universities had rightfully hesitant or non-responsive folks. Research is historically extractive in these spaces. This kind of research is sensitive and requires ethical consideration. The parameters required attention to detail and close monitoring.
Synthesis was meticulous and stakeholders were given opportunities to provide proactive feedback. There was some scope creep, and they attempted to shift the scope several times. Though challenging, this work is supposed to be published, TBA, as a public good and can be used to inform systems at a national scale. It holds insights for systems currently existent or those to be built.
I gleaned insight on the value of transparency on constraints, proactive conversations, feedback and the continuous negotiation of limitation or possibility for effective action.